
How to properly utilise measurable digital marketing with revenue-based outcomes.
Digital marketing is awash in metrics: impressions, clicks, likes, shares, follower growth, engagement rate. These numbers feel productive until you compare them to the one metric that actually matters: revenue. Most campaigns today cannot trace a single dollar of sales back to a specific ad, keyword, or email. In this guide we explain how to structure campaigns so every touchpoint maps back to actual revenue — from attribution models to LTV-based bidding — and how Eco's platform puts revenue-native measurement at your fingertips from day one.
Market guide from the Eco team · ~9 min read
Beyond vanity: why clicks and likes don't pay the bills
A Facebook ad gets 10,000 impressions and 500 clicks. A Google campaign drives 2,000 sessions. An email newsletter reaches 5,000 subscribers with a 25% open rate. On the surface, these look like wins. But none of them answer the question that actually matters: did any of this generate revenue? And if so, how much, and at what cost?
The gap between activity and outcome is the defining problem of modern digital marketing. According to Gartner's 2024 CMO Survey, only 22% of marketers say they can definitively prove the ROI of their marketing investments[1]. The rest are flying blind, optimizing for metrics that may be easy to measure but are at best correlates of business success — not the thing itself.
challenge is measurability
in 2024 without revenue tie
The root cause is simple: most marketing stacks treat traffic as the goal, not revenue. Analytics tools count sessions but not sales. Ad platforms optimize for clicks, not conversions. Email tools track opens but not repeat customers. Without a closed loop from first touch to final sale, marketing becomes a cost center whose value is inferred, not proven.
"If you can't measure it against revenue, you can't manage it against return. Vanity metrics are the enemy of accountability."
Revenue-based marketing flips the equation. Instead of asking "how many people saw this ad?" it asks "how much revenue did this ad generate, net of its cost?" Instead of "how many people clicked?" it asks "what is the lifetime value of a customer who clicked here?" The difference is not just in reporting — it is in how every decision gets made.
The revenue-based marketing framework
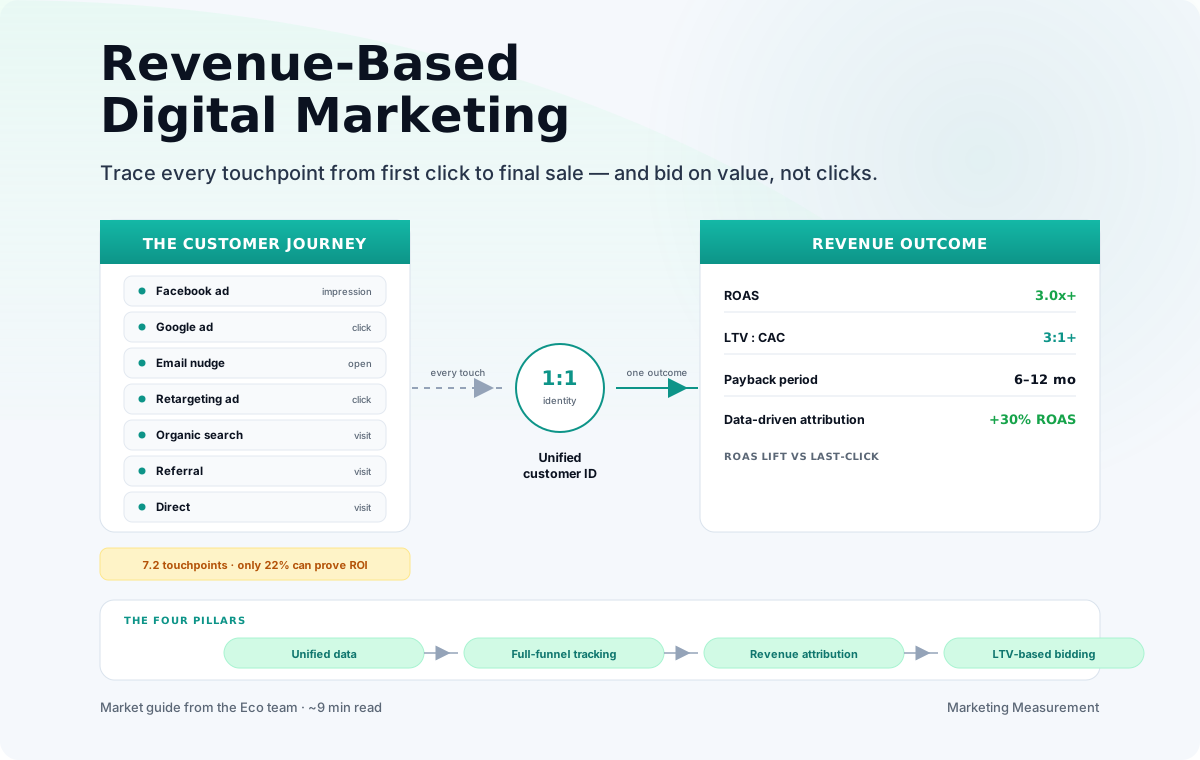
Revenue-based marketing is not a tool you buy — it is a discipline you build. It rests on four pillars, each of which must be present for the system to function:
The four pillars
If any pillar is missing, the loop breaks.
1. Unified data: one customer record
In a fragmented stack, a customer who sees a Facebook ad, clicks a Google ad, opens an email, and finally converts in-store appears as four separate people in four different systems. Revenue-based marketing requires a single customer view — one identity that stitches every interaction together, regardless of channel or device[2].
This is not just about deduplication. It is about knowing that the person who clicked yesterday's email is the same person who will buy next week — and that their LTV should influence how much you spend to re-engage them today.
2. Full-funnel tracking: every touchpoint traced
Last-click attribution gives 100% credit to the final click and 0% to everything that came before. But Adobe's Digital Economy Index finds that the average customer touches 7.2 channels before converting[3]. Those upstream touches — the awareness campaign, the comparison research, the retargeting nudges — are where the real influence lies. Revenue-based marketing tracks the entire journey, not just the last step.
3. Revenue attribution: sales tied to source
Attribution is the bridge between marketing activity and business outcome. Without it, you are investing in a black box. Google's own research shows that data-driven attribution models can improve ROAS by up to 30% compared to last-click alone[4]. The trick is not just having the model — it is having the data to feed it.
4. LTV-based bidding: spend on value, not clicks
When you know a customer's lifetime value, you can bid with confidence. A customer worth $300 over two years justifies a $90 acquisition cost — a 3:1 return on just the first purchase. Bain & Company research shows that increasing customer retention rates by 5% increases profits by 25–95% depending on the industry[5]. Revenue-based bidding means you spend more to acquire high-LTV customers, and less on one-time buyers.
Data-driven attribution models improve marketing efficiency by up to 30% by distributing credit across the full funnel[4].
Attribution models: choosing the right lens for revenue
Not all attribution models are created equal. Each answers a different question and serves a different purpose. Here is how the major models compare when your goal is revenue optimization:
| Model | How it distributes credit | Best for | Revenue impact |
|---|---|---|---|
| Last-click (default) | 100% to the final click | Basic tracking, quick setup | Baseline (0% improvement) |
| First-click | 100% to the first touchpoint | Awareness campaign measurement | +5–10% on awareness ROI |
| Linear | Equal credit across all touchpoints | Balanced view of the full journey | +20–25% on campaign efficiency |
| Time-decay | More credit to touchpoints closer to conversion | Research-heavy consideration cycles | +15–20% on retargeting ROI |
| Data-driven | Machine learning distributes credit based on actual impact | Full-revenue optimization | +25–30% on overall ROAS |
Choosing your model
The right model depends on your business and your goals. For direct-to-consumer e-commerce with short consideration cycles (fashion, electronics, impulse buys), data-driven or linear models capture the full journey accurately[4]. For high-consideration B2B or big-ticket items, time-decay models reflect the elongated research phase. For brand building, you may run two models simultaneously — last-click for conversion optimization and first-click or linear for awareness measurement.
The key insight: attribution is not a reporting exercise. It is a budget allocation tool. When you shift 20% of your budget from last-click-favored channels to first-click-favored channels, you are not being altruistic — you are investing in the touchpoints that drive future demand at a below-market CAC.
Metrics that matter: the revenue-native KPI set
Before you can measure revenue-based outcomes, you need to define what "success" looks like in revenue terms. These are the five metrics that every revenue-native marketing team tracks:
Target: 3.0x+
Target: 3x CAC+
Target: < 33% of LTV
Target: < 12 months
Target: positive
Target: 2.5%+
ROAS: return on ad spend
ROAS = Revenue ÷ Ad Spend. It is the most direct measure of whether a campaign paid for itself. But ROAS without context is misleading: a 4x ROAS on a $5 product with a 20% margin is worse than a 2.5x ROAS on a $200 product with a 50% margin, because the dollar profit differs dramatically. Always interpret ROAS alongside contribution margin.
LTV to CAC ratio
Customer Lifetime Value divided by Customer Acquisition Cost is the fundamental health check of any e-commerce business. A ratio above 3:1 means you are acquiring customers profitably and have room to scale. Below 3:1, you are burning cash on acquisition. Above 5:1, you are likely leaving growth on the table by under-investing[5].
Payback period
Even a profitable customer can be destructive if the payback is too long. A 12-month payback period means you need cash reserves to float the customer until they become profitable. The ideal payback for most e-commerce businesses is 6–12 months, which balances growth and liquidity[6].
How Eco embeds revenue-native analytics from day one
The challenge with revenue-based marketing is not the methodology — it is the integration. Most stores string together a patchwork of tools: Google Analytics for web tracking, a CRM for customer data, a separate attribution platform, and a spreadsheet for LTV calculations. Each tool holds a fragment of the truth, and stitching them together requires engineering resources most merchants don't have.
Eco eliminates the fragmentation by building revenue-native analytics into the product record. Every customer interaction — from ad click to purchase to repeat order — is tied to a single customer identity and a single product catalog. That means:
- Full-path attribution — every touchpoint leading to a sale is tracked, weighted by its actual influence, not a fixed model.
- Real-time ROAS — ad spend, revenue, and margin are computed live, so you can adjust budgets mid-campaign.
- LTV forecasting — built-in LTV models update as customers continue to purchase, so your bidding strategy evolves with real behavior.
- CAC by channel — acquisition cost is automatically computed for every channel, so you know exactly where to double down and where to pull back.
- Payback curves — interactive dashboards show how long each cohort takes to reach profitability.
- Export-ready — all metrics can be exported to your ERP or warehouse for deeper analysis.
Revenue-native analytics, built in
No third-party stitching required.
"Before Eco, we had seven screens open just to figure out if a campaign was profitable. Now it is one dashboard, and the numbers match our bank statement." [Eco testimonial]
From clicks to revenue: a marketing checklist
Revenue-based marketing is a practice, not a project. Here is how to audit your current setup and close the loop on every campaign.
What marketers see when it works
"Switching to data-driven attribution and LTV-based bidding lifted our ROAS from 2.1x to 4.8x in six months. The extra margin funded our entire holiday creative budget." [Eco testimonial]
"For the first time, marketing can show the CFO exactly how much revenue each channel generated last quarter. The conversations have changed from 'how many clicks?' to 'how much profit?'" [Eco testimonial]
Markets using data-driven attribution and LTV-based bidding see an average 76% lift in measurable ROAS.