
The time value of wish lists — and why a saved item is a ticking investment.
In finance, a dollar today is worth more than a dollar tomorrow because it can earn interest and because the future is uncertain. The same is true in e-commerce: a wishlisted item has a present value, a decay rate, and a range of "interest-bearing" triggers that determine whether that saved intention becomes a sale. In this piece we translate the economics of time value into the language of the storefront.
Market guide from the Eco team · ~8 min read
Why a wish list is not a bookmark
A wish list entry looks passive: a shopper clicks a heart, the product gets filed away, and life moves on. But that click is the first deposit into a time-sensitive account. The shopper has signalled real intent — they browsed, they evaluated, they paused — yet they are not ready to pay. That gap is where time does its work.
Economists call this the time value of money: a dollar in hand today is worth more than a promised dollar tomorrow because it can be invested, reinvested, and used to capture other opportunities before risk and uncertainty erode it. The parallel in commerce is exact. A wishlisted item’s present value is the probability-weighted chance it will convert now, discounted by how much that chance will decay the longer it sits untouched.
The data confirms the urgency. Across a multi-industry study of 49,000 merchant accounts and millions of shopper sessions, the median time from wish-listing to purchase is 41 days [1]. Even more telling, 74.7% of purchases happen within 30 days of an item being wish-listed, while the remaining 25.3% drift out to 120 days or beyond. That means intent follows a steeply declining curve: most of the value is realized early, and what lingers is a slow tail of forgotten browsers.
The financial parallel
Mapping finance concepts onto wish-list behaviour.
The decay curve is steeper than most stores think
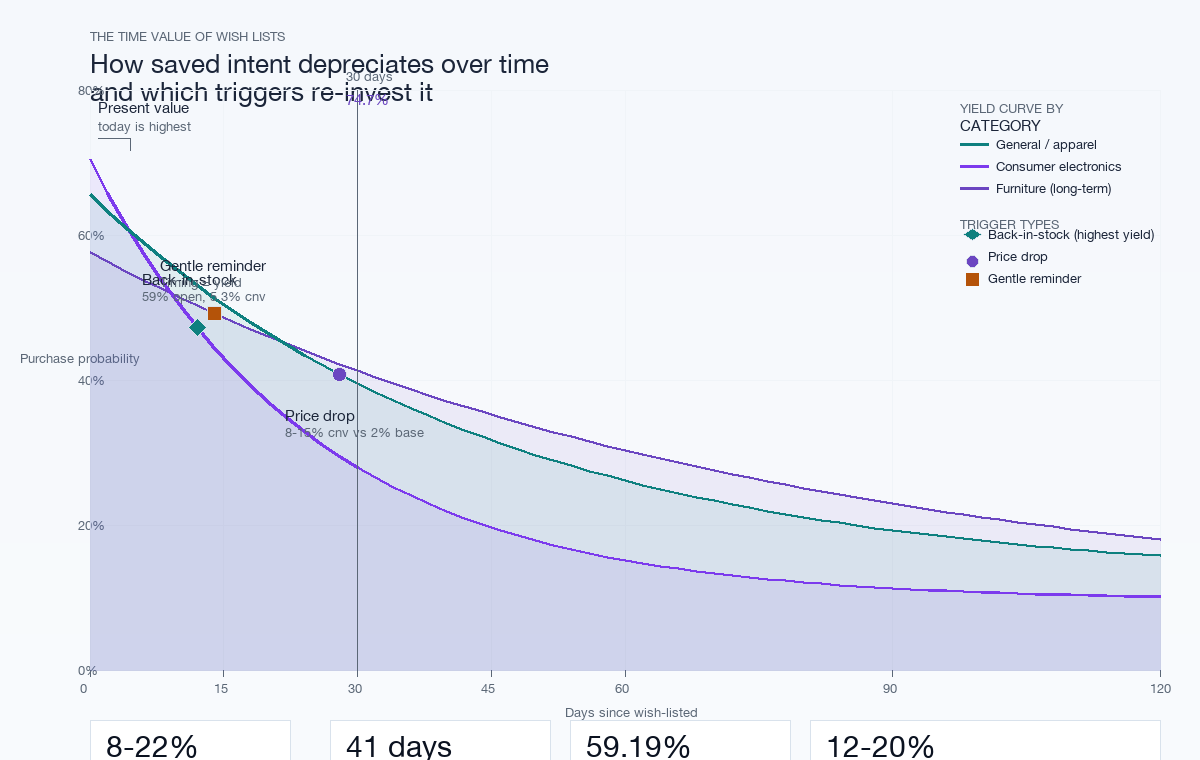
Left to itself, a wish list is a passive file. Conversion probability does not stay flat — it depreciates, much like inventory that loses its markdown window. The mechanism is behavioural, not magical: a reminder that lands while intent is still warm finds a shopper who already half-committed; the same reminder three weeks later finds someone who has moved on, scrolled past, or forgotten entirely.
One retailer that automated price-drop emails on wish-listed items cut the average time from wish-list to purchase from 45 days down to 18 days and watched wishlist conversion climb from 8% to 22% [1]. That is the equivalent of a high-interest reinvestment: the storefront paid back the capital it had lent in attention.
The counter-intuitive part is that this decay is asymmetric. A gentle 24-hour nudge to a warm browser lands while the decision is still forming. But a shopper who has gone cold for two weeks needs a different instrument — urgency, exclusivity, or a concrete price change, not another "did you forget something?" ping.
Every category has its own yield curve
Just as bonds with different maturities carry different yields, wish-listed products have different natural horizons. Short-horizon categories — consumer electronics, fashion drops, seasonal goods — convert fast because the decision is quick and the risk of substitution is high. Long-horizon categories — furniture, home improvement, B2B equipment — sit longer because the purchase is deliberate and often budget-linked.
Electronics shoppers are the extreme example: they convert fastest of any segment, averaging just 18.56 days, with 84.55% completing their purchase within the first month [1]. For a high-consideration category that same window might be six months. The yield curve tells you not just when to follow up, but when not to: pinging a furniture buyer 24 hours after they save is like calling a bond trader who just bought a 10-year — the timing is wrong, and the cost of the wrong pitch is higher than the cost of waiting.
| Category | Avg days to purchase | Converts in 30 days | Best trigger timing |
|---|---|---|---|
| Consumer electronics | 18.6 days | 84.6% | Stock + 24h |
| Impulse / fashion drops | 2–7 days | 90%+ | 24h gentle nudge |
| General apparel | 15–25 days | ~70% | 3–5 day reminder |
| Home & kitchen | 25–45 days | ~55% | 7-day reminder + week 2 |
| Furniture / big-ticket | 45–90+ days | 40% | 14-day cadence, stock alerts |
Read the curve, don't fight it
The median shopper takes 41 days to purchase from a wish list [1], but that median is an average of very different behaviours stitched together. Treating every wish-list save as a 41-day story is the same error as treating a 3-month Treasury bill and a 30-year bond as fungible. The fix is segmentation: route electronics saves into a fast-lane 24-hour flow, and furniture saves into a patient, 14-day cadence. Each follow the shape of its own curve.
Interest rates: not all triggers are equal
In the time-value framework, "interest" pays for the delay — it is the trigger that re-primes dormant intent and lifts conversion above the natural decay rate. The good news is that some triggers carry genuinely higher yields, and the bad news is that timing them wrong can invert the return.
Back-in-stock alerts are the risk-free rate of wish-list recovery. They only fire when the obstacle to purchase has literally been removed, so the conversion floor is high and the timing is externally set by supply, not by a calendar. Their open rates reflect that: back-in-stock emails see a 59.19% open rate and convert at 5.34%, making them the highest-converting automated email type [1]. A case study recorded back-in-stock alerts converting at 22.45% on average [1]. Their strength is that they convert intent that was blocked, not lost.
vs 1.5–2.5% baseline
conversion range
Price-drop alerts sit one rung below: they convert at 8–15% against a 1.5–2.5% store-wide baseline [1], because they answer the question "was it worth waiting?" with a concrete yes. Crucially, the price must actually move on the platform record — slapping on a discount code does not reprice the trigger [7].
Gentle reminders are the coupon that pays interest only if timed to the curve. Industry guidance is to follow the product type [5]:
| Product type | First reminder | Expected effect |
|---|---|---|
| Impulse buys | 24 hours | Recovers browsers still in the decision loop |
| Regular items | 3–7 days | Respects a normal deliberation window |
| High-value products | 7–14 days | Avoids premature fatigue on long-consideration items |
| Seasonal items | Before season ends | Aligns the nudge to the natural purchase window |
Send a 24-hour nudge to a $1,200 sofa and you have burned the highest-yield touch on someone who was never going to buy in the next three weeks. Send a 14-day nudge to a $49 phone case and that same shopper has already ordered it from your competitor. Timing is the interest rate.
Inflation risk: what erodes wish-list value
Even a perfectly timed trigger can fail if "inflation" — the gradual erosion of a wish list's purchasing power — has already done its damage. In the real economy, inflation is the silent tax on cash balances. In the storefront economy, inflation has three faces:
- Substitution — a competitor's price drop or a better alternative that the shopper discovers between save and follow-up. The wish list's value depreciates the moment the market moves.
- Stockout — a wish-listed item going out of stock doesn't just pause the sale; it resets the decision. Back-in-stock alerts are the hedge against this, which is why they carry the highest yields [1].
- Mindset drift — the shopper's circumstances change. A gift idea becomes irrelevant, a budget gets reprioritised, a need is satisfied elsewhere. The longer the lag, the higher the probability of drift.
"A wish list with no email attached to it is a filing cabinet. The value lives almost entirely in the follow-up."
The compounding insight is that drift is measurable: products with high save counts but low conversions are the portfolio entries quietly bleeding value [3]. Each high-saves, low-conversion item is a prompt to inspect the gap before it erodes further: is the price stale, are the reviews absent, is the trust signal missing?
A quick ROI model for wish-list time value
The cleanest way to value a wish list is to treat it as the incremental demand it actually is, not as the vanity metric it often pretends to be. A wish list does not raise same-session conversion — it moves a purchase to a later date [2]. So the question is not "does the heart icon convert?" but "what is the lifetime uplift per visitor once we attach a trigger strategy to it?"
The uplift, per visitor
A simplified model you can plug store numbers into.
Take a store with 1,000 monthly visitors. If 8% of product-page visitors save an item [3], that is roughly 80 wish-list events. Without a trigger, the recovery sits near the 5–8% band [4]. With a trigger stack — a gentle 3-day reminder, a back-in-stock alert, and a price-drop alert — recovery lifts toward the 12–20% band [4]. At a $89 AOV and 14% recovery, that 80 saves becomes roughly $1,000 of incremental revenue per month from a feature that cost minutes to switch on. The trigger did the work; the save merely held the capital.
Compounding, not single-shot
The most valuable stores do not fire one email and stop. They sequence: a soft nudge at the category-appropriate interval, a stock check, and a price signal if margin allows [5]. Adobe Commerce documentation calls this "repeatability" — a rule that re-fires so the same shopper is not counted once and abandoned [6]. In time-value terms, this is compounding interest on intent: each touch re-prices the saved item, and the right sequence lifts the present value of the original save.
A stacked flow (reminder + back-in-stock + price drop) lifts recovery into the 12–20% band vs. 4–8% untriggered [4].
Managing wish-list time value: a merchant checklist
Getting the time value of wish lists right is less about collecting more saves and more about paying attention to when you re-engage each save.
What merchants see when it works
"We launched in an afternoon. The trigger stack alone doubled our first-week conversions on saved items." [Eco testimonial]
"Customers actually thank us for the points program. Repeat orders are up 40%." [Eco testimonial]